Gravity Model of Spatial Interaction
3/6/21
DELIVERABLES
- Web map of hospital catchments in MA
- Static map of hospital catchments in MA
- Gravity model: .model3
- Gravity model: .png
- Workflow for preprocessing hospital data
PURPOSE OF THE MODEL
This gravity model can take any two input and target layers, convert them to points using centroids, weight by any numerical attribute, and find the relationships with the highest potential using a distance matrix. The model also allows exponent parameters for distance and weights to be adjusted. It will then create catchments that show spatially the reach that each target point has on its surrounding area by dissolving input geometries with each other.
Inputs include input & target features and their unique ID and weight fields.
Additionally, advanced options include changing distance friction (beta or β, default: 2),
the input weight exponent (lambda or λ, default: 1), and the target weight exponent (alpha or α, default: 1).
These advanced inputs were taken from Rodrigue’s gravity model as described in
The Geography of Transport Systems,
which uses the formula (inputWeight)^λ * (targetWeight)^α / (distance)^β.
I originally used this model to define hospital catchments based on distance, number of hospital beds, and population in surrounding areas. However, because this gravity model has been generalized to any spatial input and target layers with any weight attributes, it can be applied many other situations that require measuring spatial relationships. This is the beauty of a model; it allows for generalization to then be applied to different situations, consistency in methods, and situations where data change and methods need to be rerun. The model is also open source; the .model3 can be found here, and a .png image of the model can be found here.
HOSPITAL DATA PREPROCESSING
When applying the gravity model specifically to hospital data using data from Homeland Security, the data need to be preprocessed to:
- remove hospitals not meant for public use, hospitals without beds, and closed hospitals, and
- aggregate hospitals by ZIP code and calculating the mean coordinates (centroids would also work) of the hospitals, given hospitals close together are often in co-operation or would otherwise have the same likelihood a patient would go there.
Here is a workflow for how the Homeland Security hospital data can be preprocessed.
APPLYING THE MODEL: HOSPITAL CATCHMENTS IN MASSACHUSETTS
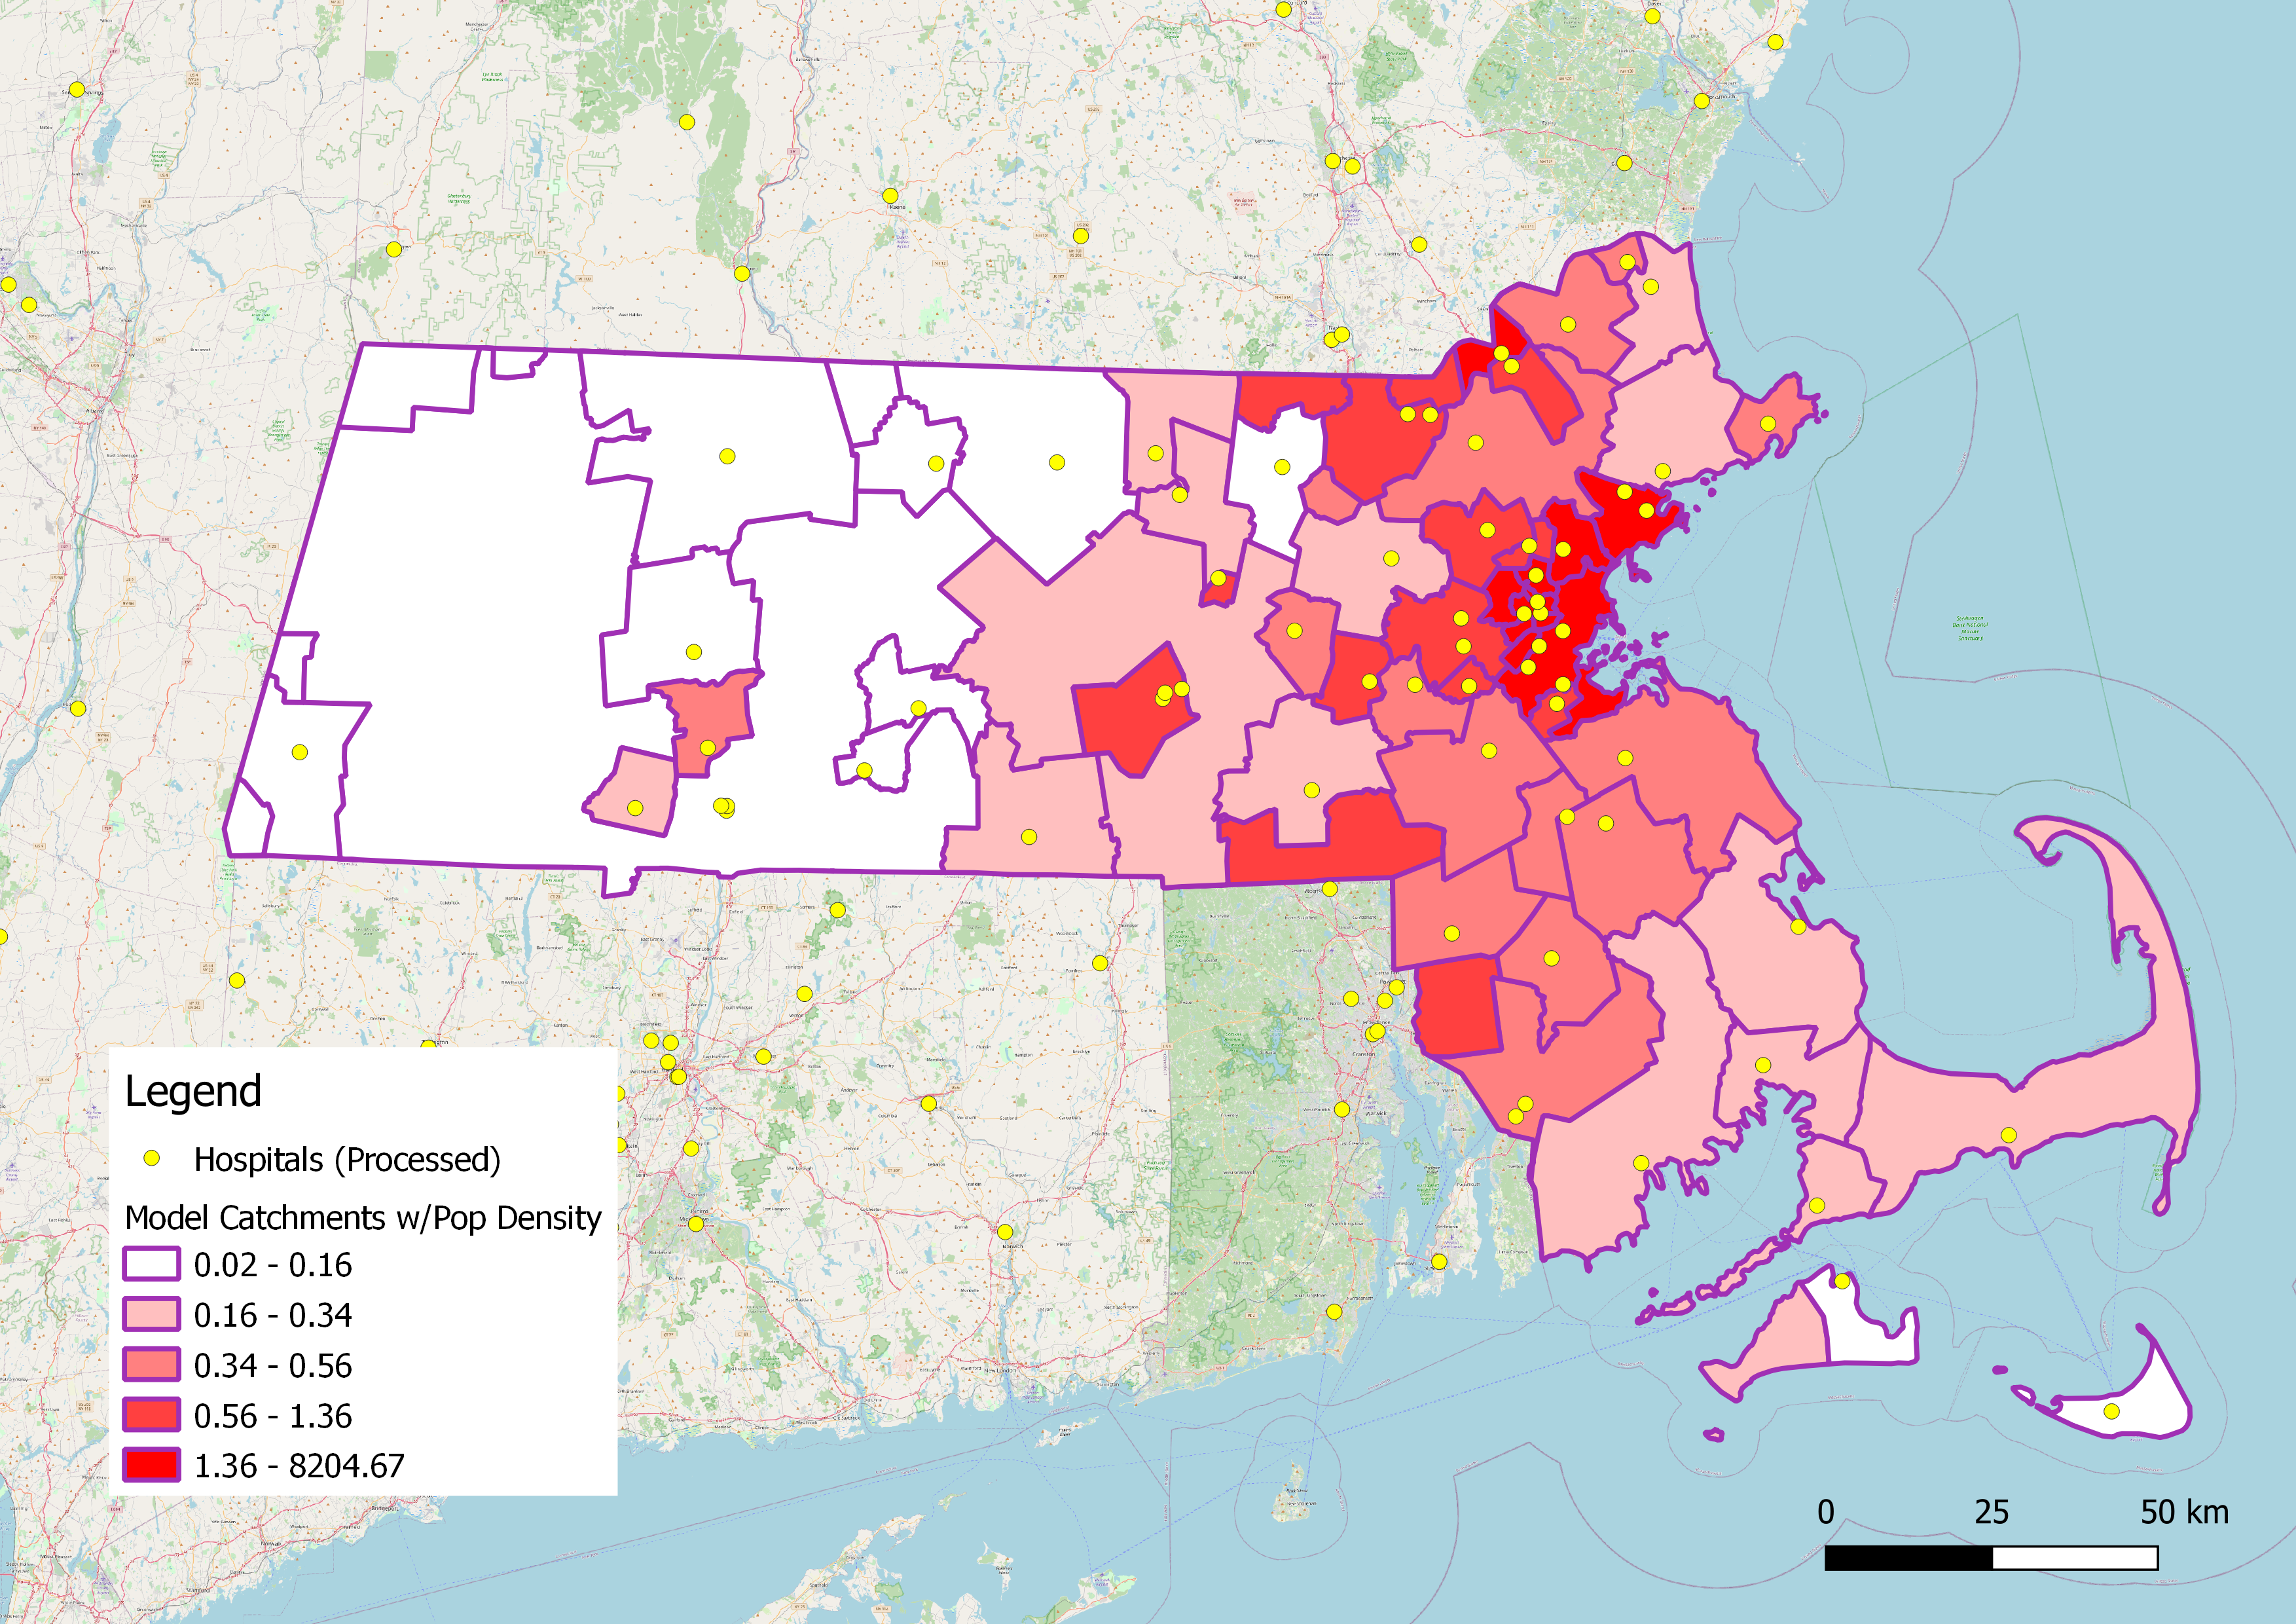
To apply the model to a specific region within New England (given I started with population data compiled by town in New England: netown.gpkg), I just needed to clip the data to my area of interest, which was Massachusetts. I used a shapefile from the TIGER Census database, and clipped the towns data to it. Because some towns may go to hospitals over state lines (thanks, Sanjana Roy, for noticing this issue), I ran a 60 km buffer on the MA shapefile (which had to be exported with a State Plane CRS to add a buffer in km) and then clipped the hospital layer to that.
Here you can find an interactive web map of hospital catchments in Massachusetts, comparing those of the model with those of the Dartmouth Atlas. I used leaflet to export my map to the web, and then adjusted the index.html file to label pop-up atttributes and add my name.

Figure 1. Hospital catchments in Massachusetts.
DISCUSSION
The Dartmouth catchments represent real population use of hospitals based on Medicare and Medicaid databases. The Massachusets catchments I produced using the model differ from the Dartmouth Health Atlas catchments, likely due to how distance, population, and beds were weighted in my model. It is also possible that the way I preprocessed my data (to exclude closed hospitals, those that are not open for public use, or those without beds, and combine hospitals in the same ZIP code) differed from the way Dartmouth Health Atlas treated theirs.
The catchments from my model and Dartmouth’s are similar in that those in and around Boston are smaller geographically as there are more hospitals and higher populations there. However, Dartmouth catchments are smaller than my model’s (this is most noticable in Western Massachusetts), indicating that distance was more of a factor in reality than my weights predicted. In other words, being close to a hospital was more important than its size. It is also possible that the Dartmouth catchments included more hospitals in their analysis than I did, which would also make catchments smaller.
DATA SOURCES
Population data for New England: netown.gpkg (compiled by J. Holler using TidyCensus)
Homeland Security Hospital Data
*Can also be added directly to QGIS using this server link: https://services1.arcgis.com/Hp6G80Pky0om7QvQ/ArcGIS/rest/services/Hospitals_1/FeatureServer
Shapefile of Massachusetts from TIGER Census database.
Dartmouth service areas: “The data set forth at this location of publication/press release was obtained from Dartmouth Atlas Data website, which was funded by the Robert Wood Johnson Foundation, The Dartmouth Clinical and Translational Science Institute, under award number UL1TR001086 from the National Center for Advancing Translational Sciences (NCATS) of the National Institutes of Health (NIH), and in part, by the National Institute of Aging, under award number U01 AG046830.”
ACKNOWLEDGEMENTS
Special thanks to Professor Joseph Holler for providing materials and guidance for this project, as well as my fellow students in GEOG0323, particularly Steven Montilla Morantes, Sanjana Roy, Maja Cannavo, and Jackson Mumper, with whom I worked the closest.